TroposphericAttenuation
•Functions and parameters contained in
this package:
In[1]:=
![RadarPackageFunctions[TroposphericAttenuation, 2]](HTMLFiles/index_1.gif)
Out[1]//DisplayForm=
![[Graphics:HTMLFiles/index_2.gif]](HTMLFiles/index_2.gif)
•Package functions and their basic documentation
along with simple examples
•AbsorptionCoefficientGasses
![[Graphics:HTMLFiles/index_3.gif]](HTMLFiles/index_3.gif)
In[2]:=
![AbsorptionCoefficientGasses[Pressure, WaterDensity, Temperature, Frequency]](HTMLFiles/index_4.gif)
Out[2]=
![AbsorptionCoefficientGasses[Pressure, WaterDensity, Temperature, Frequency]](HTMLFiles/index_5.gif)
The absorption coefficient expressed in  is
given by is
given by
![1/MetersToKilometers AbsorptionCoefficientGasses[Pressure, WaterDensity, Temperature, Frequency]](HTMLFiles/index_7.gif)
To see an example of this we use the 1976 US standard
atmosphere as a function of height and the Mid Latitude mean water
vapor density as a funciton of height. Here is the value for a milimeter
band frequency of 220 GHz:
In[3]:=
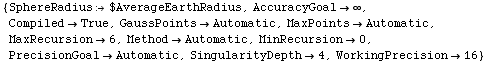
![FrequencyBand[220 GHz]](HTMLFiles/index_8.gif)
Out[3]=
In[4]:=
![h = 0 ; 1/MetersToKilometers AbsorptionCoefficientGasses[Pressure1976[h], WaterVaporDensityMidLatitudeMean[h], Temperature1976[h], 220 GHz]](HTMLFiles/index_10.gif)
Out[5]=

Of course at a higher elevation the attenuation is
less:
In[6]:=
![h = 5 KilometersToMeters ; 1/MetersToKilometers AbsorptionCoefficientGasses[Pressure1976[h], WaterVaporDensityMidLatitudeMean[h], Temperature1976[h], 220 GHz]](HTMLFiles/index_12.gif)
Out[7]=

Here is a plot of the absorption coefficient as a
function of frequency at sea level
In[8]:=
![LogLogPlot[1/MetersToKilometers AbsorptionCoefficientGasses[Pressure1976[0], WaterVaporDensity ... 76[0], ν GHz], {ν, .1 , 300}, PlotRange -> All, Frame -> True, Axes -> False] ;](HTMLFiles/index_14.gif)
![[Graphics:HTMLFiles/index_15.gif]](HTMLFiles/index_15.gif)
For comparison, here is the same plot at a height
of 20 kilometers.s
In[9]:=
![LogLogPlot[1/MetersToKilometers AbsorptionCoefficientGasses[Pressure1976[20 KilometersToMeters ... ters], ν GHz], {ν, .1 , 300}, PlotRange -> All, Frame -> True, Axes -> False] ;](HTMLFiles/index_16.gif)
![[Graphics:HTMLFiles/index_17.gif]](HTMLFiles/index_17.gif)
•AbsorptionCoefficientOxygen
![[Graphics:HTMLFiles/index_18.gif]](HTMLFiles/index_18.gif)
•AbsorptionCoefficientRain
![[Graphics:HTMLFiles/index_19.gif]](HTMLFiles/index_19.gif)
A plot for a particular rain rate as a funciton of
frequency in GHz (in dB/km):
In[10]:=
![acRainV = Plot[AbsorptionCoefficientRain[4, ν GHz]/MetersToKilometers, {ν, 1, 400}, Frame -> True] ;](HTMLFiles/index_20.gif)
![[Graphics:HTMLFiles/index_21.gif]](HTMLFiles/index_21.gif)
Here is the corresponding plot for horizontal polarization:
In[11]:=
![acRainH = Plot[AbsorptionCoefficientRain[4, ν GHz, Polarization -> HPolarization]/MetersToKilometers, {ν, 1, 400}, Frame -> True, PlotStyle -> RGBColor[.7, 0, 0]] ;](HTMLFiles/index_22.gif)
![[Graphics:HTMLFiles/index_23.gif]](HTMLFiles/index_23.gif)
In[12]:=
![Show[acRainV, acRainH] ;](HTMLFiles/index_24.gif)
![[Graphics:HTMLFiles/index_25.gif]](HTMLFiles/index_25.gif)
In[13]:=
![AbsorptionCoefficientRain[{r, f}]](HTMLFiles/index_26.gif)
Out[13]=
![(2387 13/582016301^(1/2) r^(13000 + 372 (1 - (1 + (2500 Log[5]^2)/(9 Log[10]^2))^(1/2)))/10000)/2400000](HTMLFiles/index_27.gif)
•AbsorptionCoefficientWater
![[Graphics:HTMLFiles/index_28.gif]](HTMLFiles/index_28.gif)
•AngleBiasError
![[Graphics:HTMLFiles/index_29.gif]](HTMLFiles/index_29.gif)
In[14]:=
![AngleBiasError[30, 100, 1 Degree, IndexOfRefractionModelExponential]](HTMLFiles/index_30.gif)
Out[14]=
![° - Removed[ElevationAngleGeometric][30, 30, 3959.810814905712`, EarthRadiusScale -> 1]](HTMLFiles/index_31.gif)
•ElevationAngle
![[Graphics:HTMLFiles/index_32.gif]](HTMLFiles/index_32.gif)
In[15]:=
![ElevationAngle[30, 100, 1 Degree, IndexOfRefractionModelExponential] - Degree](HTMLFiles/index_33.gif)
Out[15]=

•GroundRangeRayTrace
![[Graphics:HTMLFiles/index_35.gif]](HTMLFiles/index_35.gif)
In[16]:=
![Clear[iorModel] ; iorModel = IndexOfRefractionModelTropospheric[Temperature1976[#], Pressure1 ... aterVaporDensityToPartialPressure[WaterVaporDensityMidLatitudeMean[#], Temperature1976[#]]] &](HTMLFiles/index_36.gif)
Out[17]=
![IndexOfRefractionModelTropospheric[Temperature1976[#1], Pressure1976[#1], WaterVaporDensityToPartialPressure[WaterVaporDensityMidLatitudeMean[#1], Temperature1976[#1]]] &](HTMLFiles/index_37.gif)
In[18]:=
![GroundRangeRayTrace[10, 100, 1 Degree, iorModel]](HTMLFiles/index_38.gif)
Out[18]=

In[19]:=
![GroundRangeGeometric[10, 100, {1 Degree}] // N](HTMLFiles/index_40.gif)
Out[19]=

In[20]:=

![GroundRangeGeometric[TransmitterHeight, TargetHeight, SlantRange] gives the arclength from the ... [TransmitterHeight, TargetHeight, {ElevationAngle}], uses the elevation angle in radians as input.](HTMLFiles/index_43.gif)
•LensLoss
![[Graphics:HTMLFiles/index_44.gif]](HTMLFiles/index_44.gif)
In[22]:=

![IndexOfRefractionModelTropospheric[Temperature, Pressure, PartialPressureH2O] gives the refrac ... and partialPressureH2O is the partial pressure of the water vapor content in millibars.](HTMLFiles/index_47.gif)
![IndexOfRefractionModelTropospheric[Temperature, Pressure, PartialPressureH2O] gives the refrac ... and partialPressureH2O is the partial pressure of the water vapor content in millibars.](HTMLFiles/index_48.gif)
In[23]:=
![Clear[iorModel] ; iorModel = IndexOfRefractionModelTropospheric[TemperatureCOSPAR[July, #, 45 ... tyToPartialPressure[WaterVaporDensityMidLatitudeMean[#], TemperatureCOSPAR[July, #, 45]]] & ;](HTMLFiles/index_49.gif)
In[25]:=

Out[25]=

In[26]:=
![LensLoss[1, 100000, 1 Degree, iorModel]^2 // TodB](HTMLFiles/index_52.gif)
Out[26]=

In[27]:=
![Options[GroundRangeRayTrace]](HTMLFiles/index_54.gif)
Out[27]=
In[28]:=
![GroundRangeRayTrace[1, 90000, 0.01 Degree, iorModel]](HTMLFiles/index_56.gif)
Out[28]=

In[29]:=
![SlantRangeRayTrace[1, 90000, 0.01 Degree, iorModel]](HTMLFiles/index_58.gif)
Out[29]=

In[30]:=
![SlantRangeGeometric[1, 90000, {0.01 Degree}]](HTMLFiles/index_60.gif)
Out[30]=

•MeasuredSlantRangeRayTrace
![[Graphics:HTMLFiles/index_62.gif]](HTMLFiles/index_62.gif)
In[31]:=
![MeasuredSlantRangeRayTrace[30, 100, Degree, IndexOfRefractionModelExponential]](HTMLFiles/index_63.gif)
Out[31]=

In[32]:=
![SlantRangeRayTrace[30, 100, Degree, IndexOfRefractionModelExponential]](HTMLFiles/index_65.gif)
Out[32]=

In[33]:=
![SlantRangeRayTrace[30, 100, - 2 Degree, IndexOfRefractionModelExponential]](HTMLFiles/index_67.gif)
Out[33]=

In[34]:=
![SlantRangeRayTrace[30, 100, 2 Degree, IndexOfRefractionModelExponential]](HTMLFiles/index_69.gif)
Out[34]=

•RangeBiasError
![[Graphics:HTMLFiles/index_71.gif]](HTMLFiles/index_71.gif)
•RayTraceGeneral
![[Graphics:HTMLFiles/index_72.gif]](HTMLFiles/index_72.gif)
•SlantRangeRayTrace
![[Graphics:HTMLFiles/index_73.gif]](HTMLFiles/index_73.gif)
•TroposphericAttenuation
![[Graphics:HTMLFiles/index_74.gif]](HTMLFiles/index_74.gif)
•WaterPartialPressureToVaporDensity
![[Graphics:HTMLFiles/index_75.gif]](HTMLFiles/index_75.gif)
In[35]:=
![WaterPartialPressureToVaporDensity[p _ p, t]](HTMLFiles/index_76.gif)
Out[35]=

•WaterVaporDensityToPartialPressure
![[Graphics:HTMLFiles/index_78.gif]](HTMLFiles/index_78.gif)
In[36]:=
![WaterVaporDensityToPartialPressure[ρ, t]](HTMLFiles/index_79.gif)
Out[36]=

Of course these two functions are inverses of each
other:
In[37]:=
![WaterVaporDensityToPartialPressure[WaterPartialPressureToVaporDensity[p _ p, t], t]](HTMLFiles/index_81.gif)
Out[37]=

|